Note
Go to the end to download the full example code
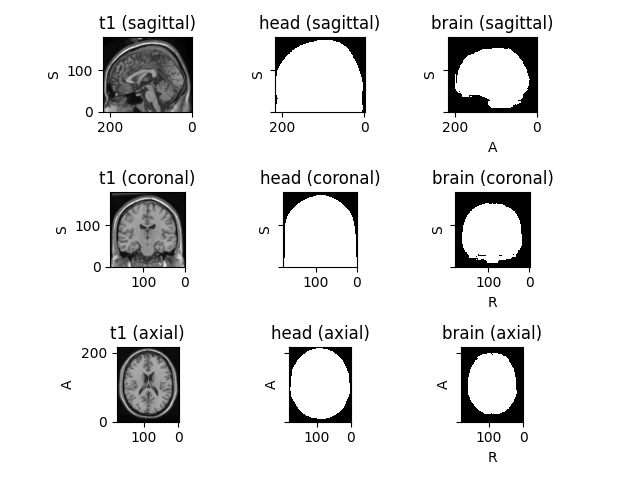
Plot a subject#
Use torchio.Subject.plot() to plot the images within a subject.
Downloading http://packages.bic.mni.mcgill.ca/mni-models/colin27/mni_colin27_1998_nifti.zip to /home/docs/.cache/torchio/mni_colin27_1998_nifti/mni_colin27_1998_nifti.zip

0it [00:00, ?it/s]
  0%|          | 0/24250681 [00:00<?, ?it/s]
  1%|          | 163840/24250681 [00:00<00:15, 1539683.83it/s]
  3%|▎         | 712704/24250681 [00:00<00:06, 3642258.78it/s]
  6%|▌         | 1376256/24250681 [00:00<00:04, 4805977.22it/s]
  9%|▉         | 2195456/24250681 [00:00<00:03, 5896221.33it/s]
 13%|█▎        | 3211264/24250681 [00:00<00:02, 7115232.39it/s]
 18%|█▊        | 4415488/24250681 [00:01<00:02, 8591535.50it/s]
 24%|██▍       | 5865472/24250681 [00:01<00:01, 10216039.72it/s]
 32%|███▏      | 7651328/24250681 [00:01<00:01, 12184111.79it/s]
 40%|████      | 9781248/24250681 [00:01<00:00, 14682527.86it/s]
 51%|█████     | 12304384/24250681 [00:01<00:00, 17790913.37it/s]
 62%|██████▏   | 14958592/24250681 [00:01<00:00, 20382877.98it/s]
 76%|███████▌  | 18432000/24250681 [00:01<00:00, 24646859.49it/s]
 94%|█████████▍| 22749184/24250681 [00:01<00:00, 30154078.74it/s]
24256512it [00:01, 13738630.03it/s]
import torchio as tio

tio.datasets.Colin27().plot()
Total running time of the script: (0 minutes 6.183 seconds)